Week 7b: AOD and CuPy
- Mar 1, 2020
- 2 min read
Alex
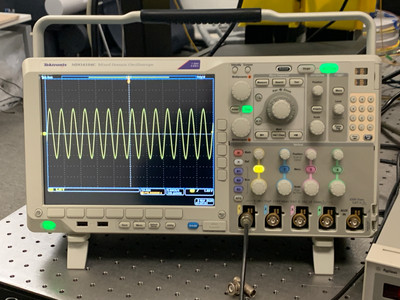
This week, we were able to make progress on understanding the functionality of the AOD. After experimenting with the function generator on the MS054, we applied a DC offset of 1V that seemed to smooth the output waveform. For modulation and in order to get any power out, an input i the range of 0-1V with a 50 Ohm input impedance must be applied. Previously, some waveforms the unit output almost seemed like noise. Fortunately, Brimrose has responded to my support requests in regards to expected results when testing the AOD and I aim to employ their help and suggestions as I work more this week.
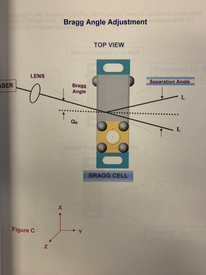
Looking ahead, Dr. Asghari helped to explain that with the center frequency of 140 MHz, the deflected angle will be in the center of its range of 30 mrad, with 100 and 180 MHz corresponding to the edges of this range. This can be better demonstrated in the informational picture from the manual below.
Tektronix has also responded to my request ticket and they will be helping me understand and hopefully resolve our shortcomings with our oscilloscopes. Primarily the low transfer speeds on the old DSA72004C scope and preparing the MS054 for data streaming.


Trevor
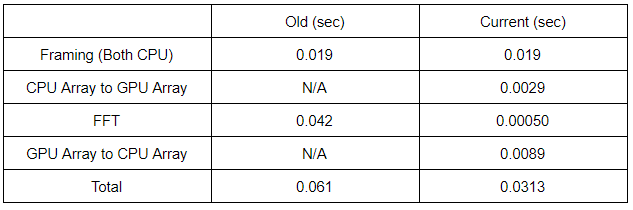
This week I was able to get the FFT to process on the GPU rather than the CPU. However, there isn’t any improvement in processing speed. As stated prior, the GPU doesn’t start processing FFT faster until a certain amount of data points are in the array. The data I am processing is only 2 million points. It can be seen in Figure 1, which has points from 1 million to 10 million in steps of 1 million, that NumPy (CPU) processes FFT faster than CuPy (GPU) up to approximately 4.6 million points. With that, the FFT will not be increasing in speed until the hardware allows more points to be captured.
Further into the processing, the current implementation takes the NumPy array and converts it to a CuPy array for FFT and back to a NumPy array from visualization. This was a work around we did because currently, the program does not recognize the CuPy array as an array that could be plotted with the current visualization method. My next steps are to research alternative methods of visualization that utilizes the GPU to its full potential. One of these methods is VisPy. This library for scientific visualization stands out as one meant for GPU acceleration and rendering millions of points in real time. From my current research, Mayavi, our current visualization library, tends to struggle with higher amounts of data. Once the hardware is able to send more data points Mayavi will begin to have trouble. VisPy does not seem to have this issue and can work with millions more data points than Mayavi can. Thus finding a way to switch over to VisPy will be helpful in improving speeds. This is not the only option, but it is the one with the most promise.

Figure 1: NumPy vs CuPy FFT
Comments